
State of Starting Up
The State of Starting Up: What people are building on Spark
We looked at about 1,500 projects people started on Spark this past month. Here's what they're building and what they plan to charge.

Each month, The State of Starting Up looks at one question about how people start businesses and make money on their own. Last month we looked at the record number of Americans filing to start a new business this year.
This month we’re looking at the kinds of businesses people build with AI, using data from Spark. When you start a project on Spark, it first writes a short plan with you: what the business does, who it’s for, and how it will make money. We sorted a sample of about 1,500 of those plans by kind of business.
What people are building
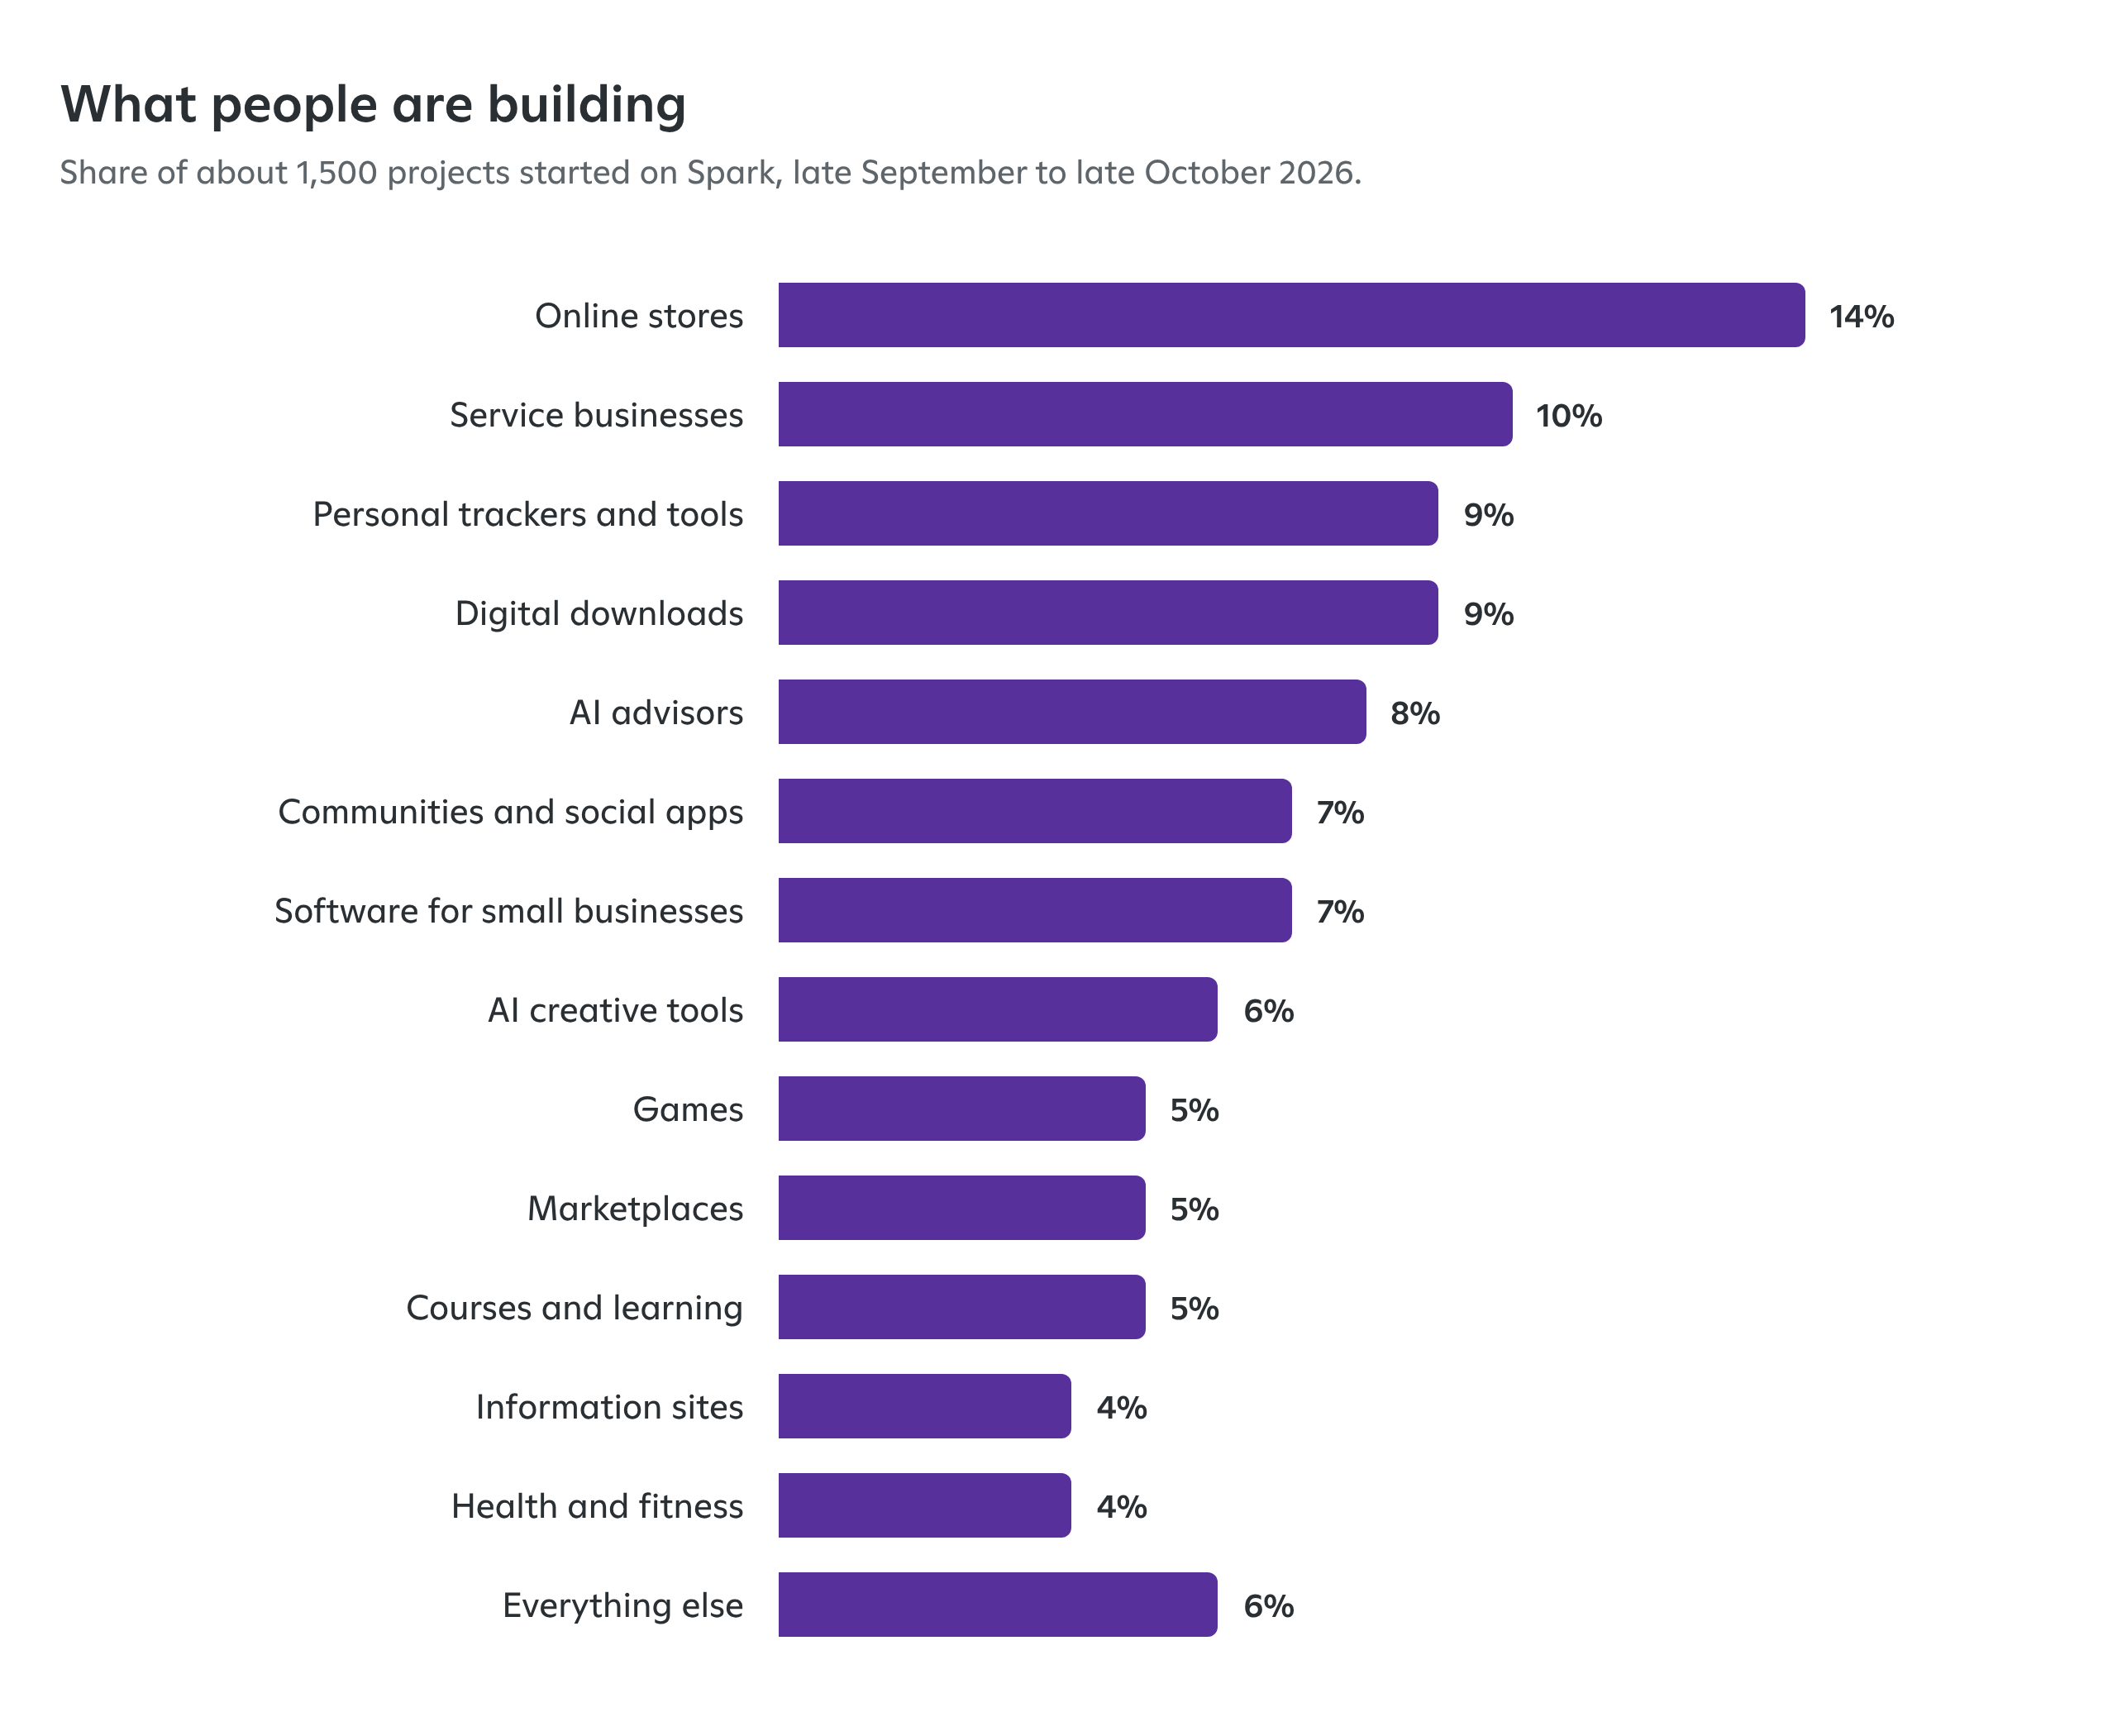
Online stores were the most common, at 14% of projects. Service businesses came next at 10%. That’s the same order we saw in last month’s Census data, where retail and services led new business applications.
After those two, the spread is wide. Personal tools, digital downloads, AI advisors, social apps and software for other businesses each make up between 6% and 9%.
The most common ideas
Online stores (14%). Mostly clothing and streetwear brands, art prints, print-on-demand shirts and mugs, candles and handmade goods. Items are usually priced around $20.
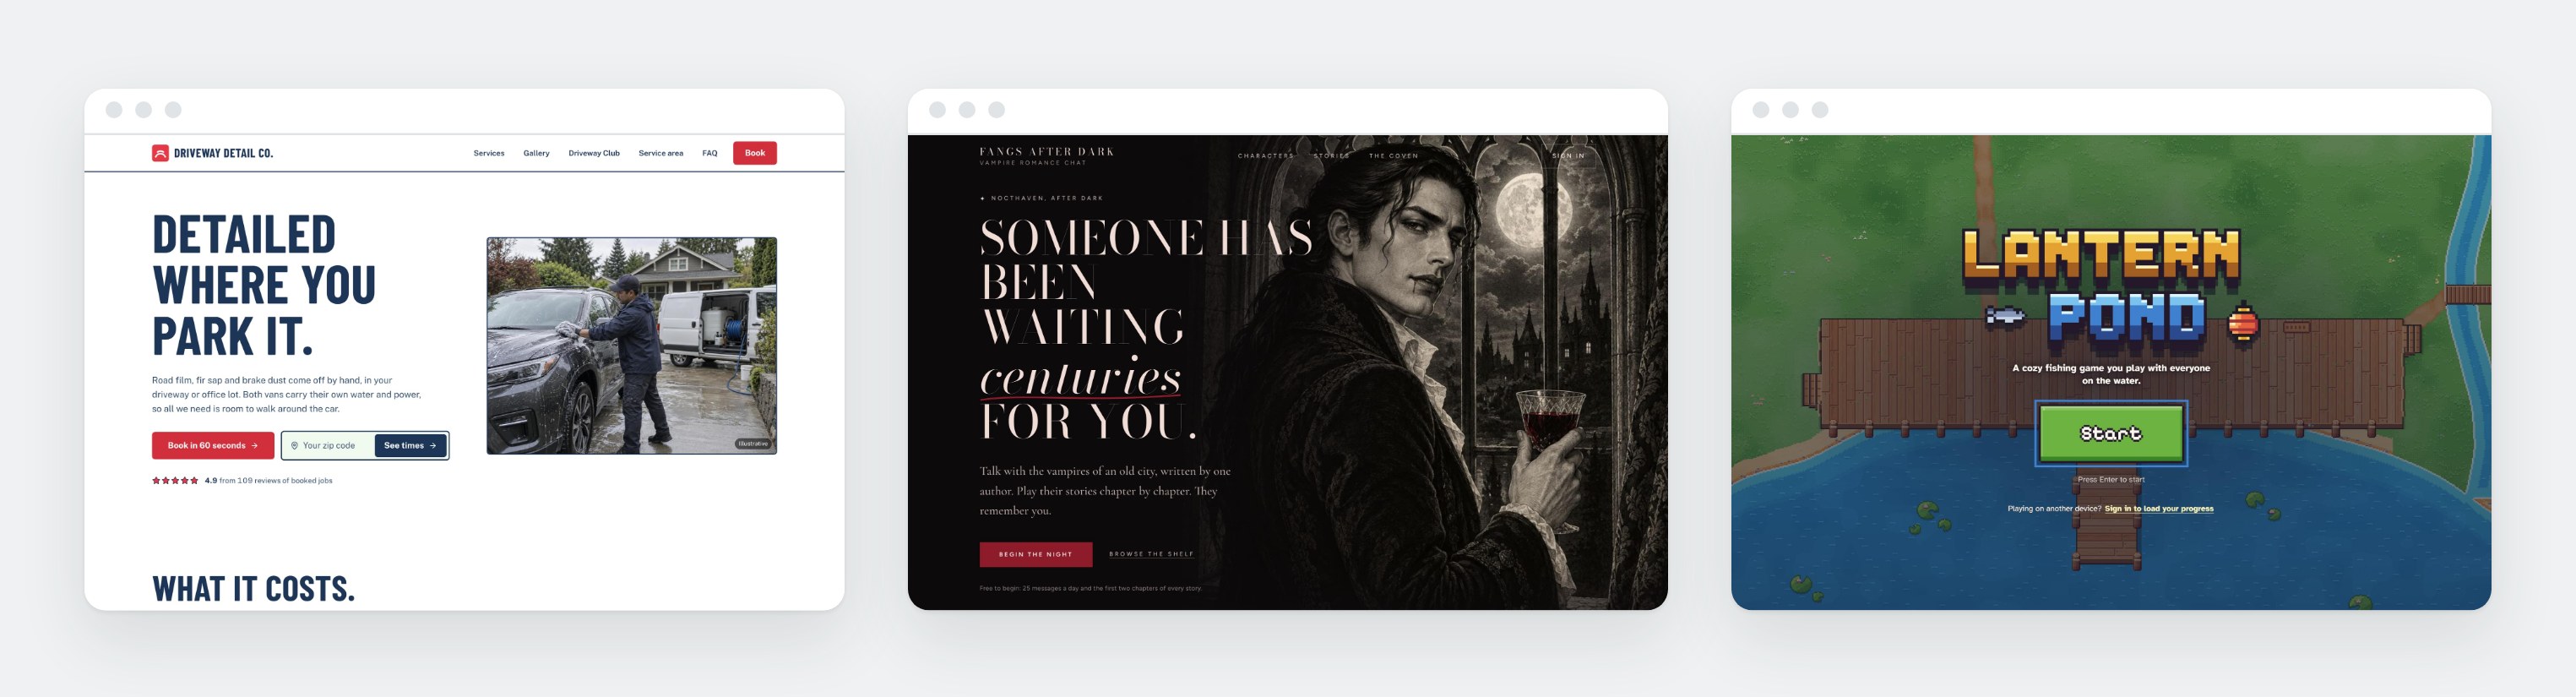
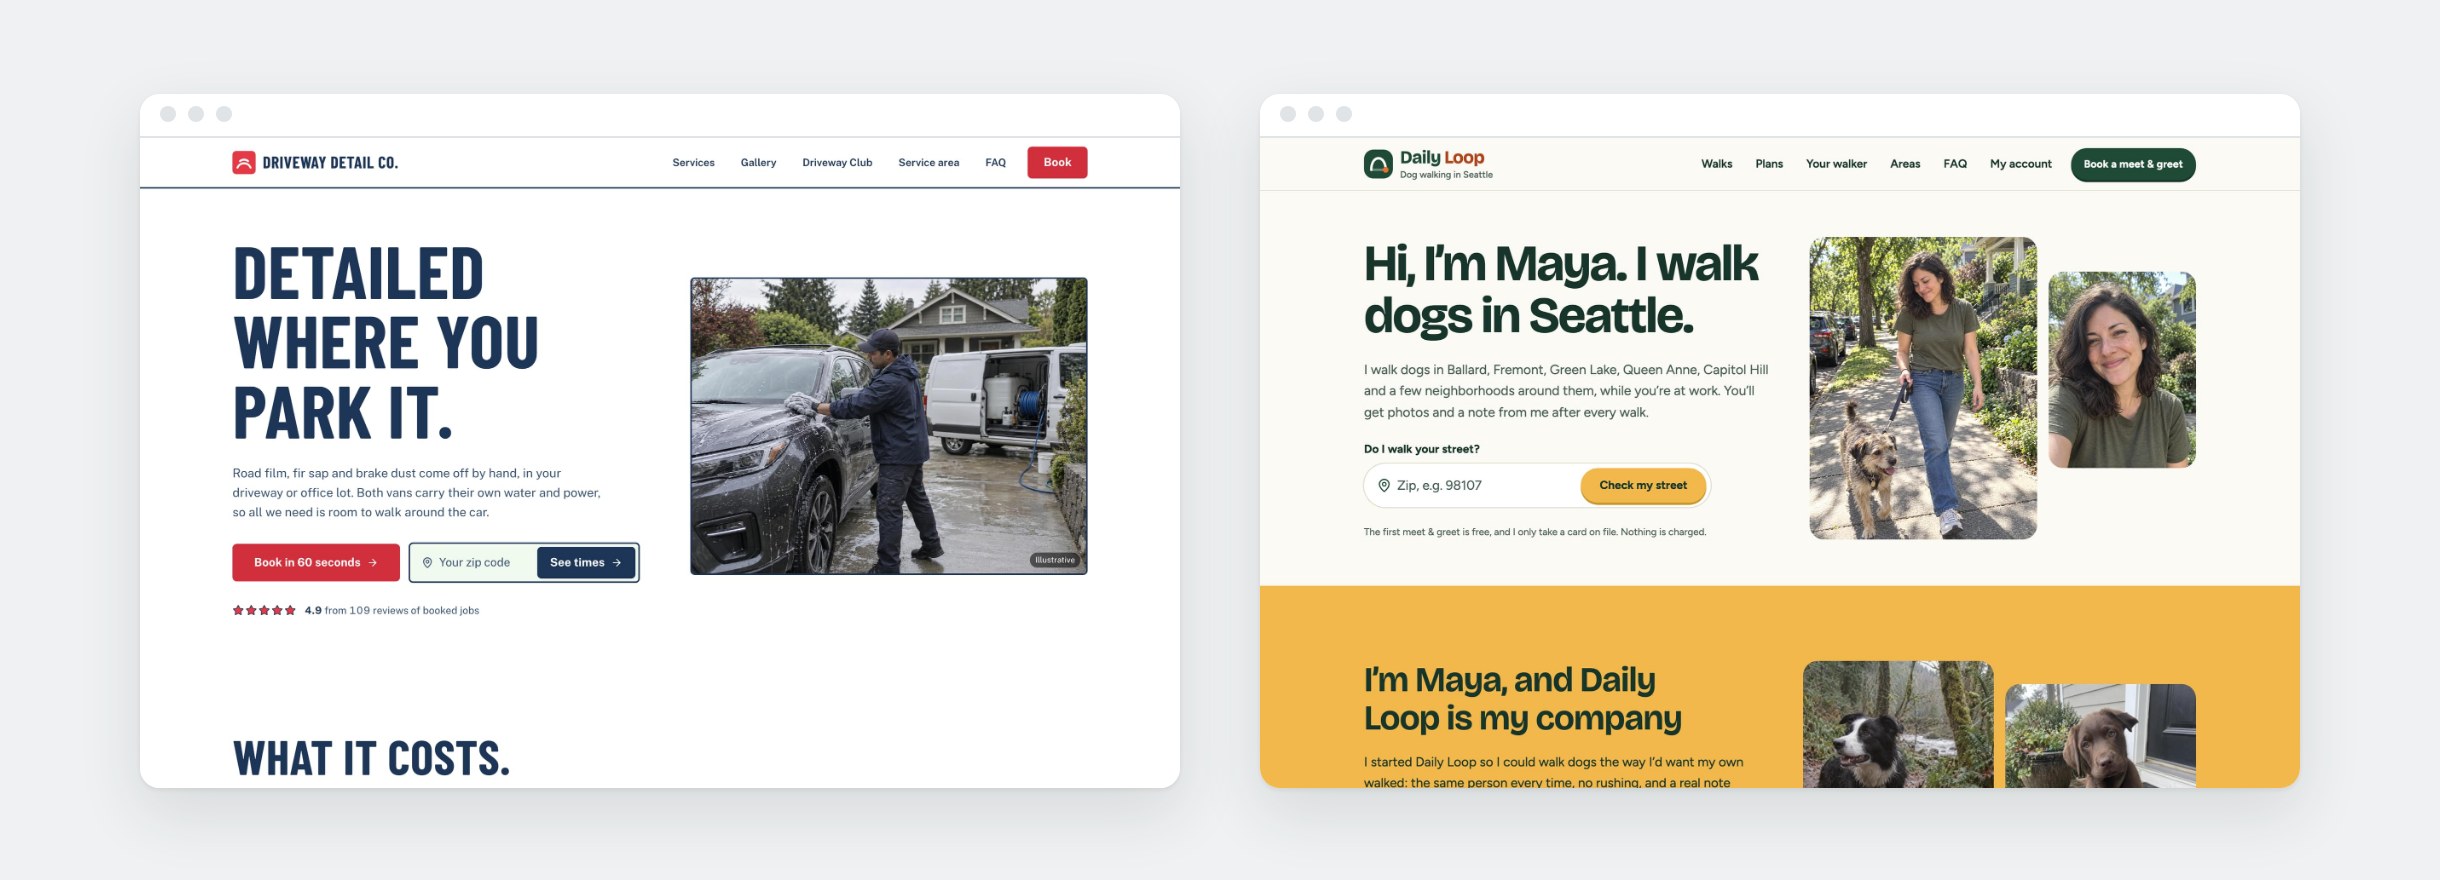
Service businesses (10%). Cleaning, handyman work, mobile mechanics, dog walking and grooming, lawn care, photography and coaching. These sites take bookings or quote requests, like the Driveway Detail Co. and Daily Loop Dog Walking templates.
Personal trackers and tools (9%). Budgets, reminders, habit trackers, grocery lists, wardrobe organizers and planners for people with ADHD. The most common plan is a subscription of about $10 a month, like the Pro plan on our Rackside Workout Tracker template. Wardrobe organizers come up too, like our Closet template, which suggests outfits from the clothes you own.
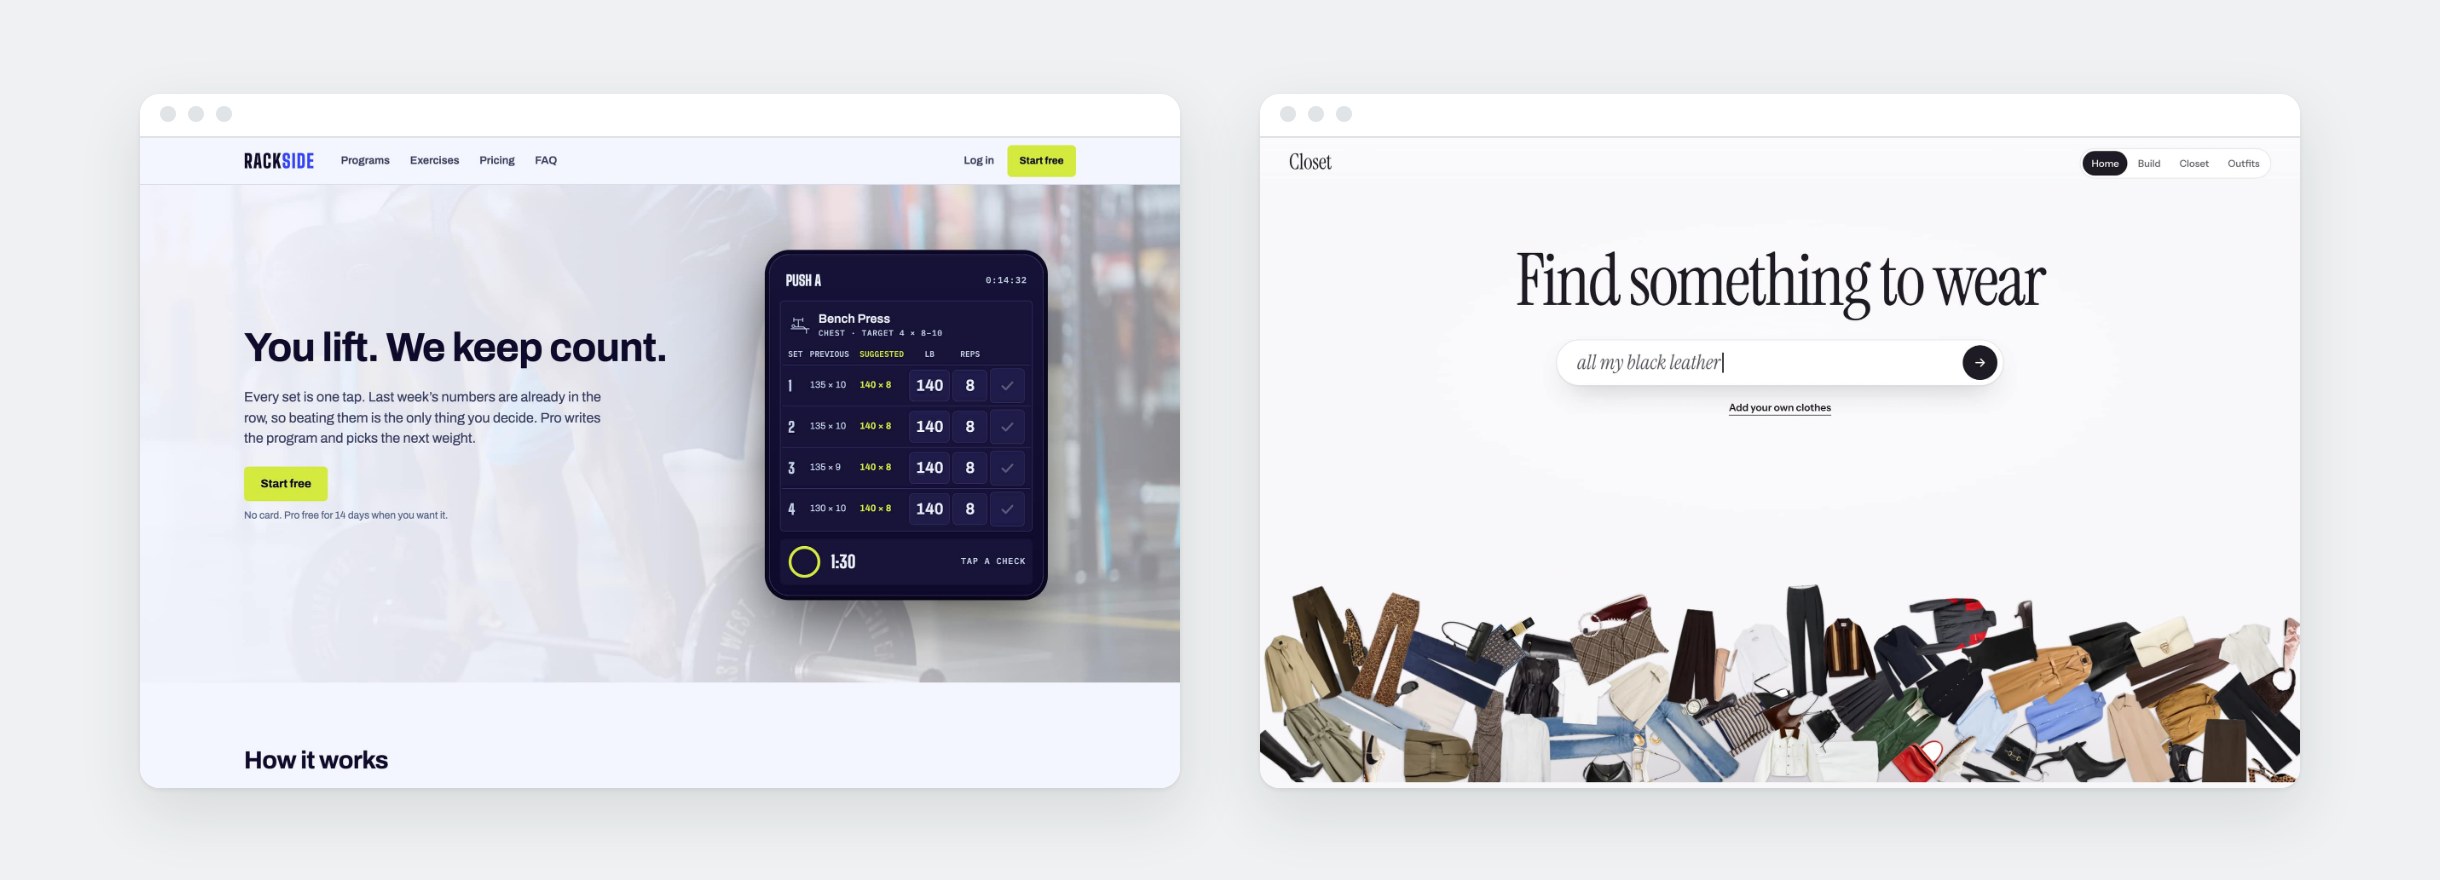
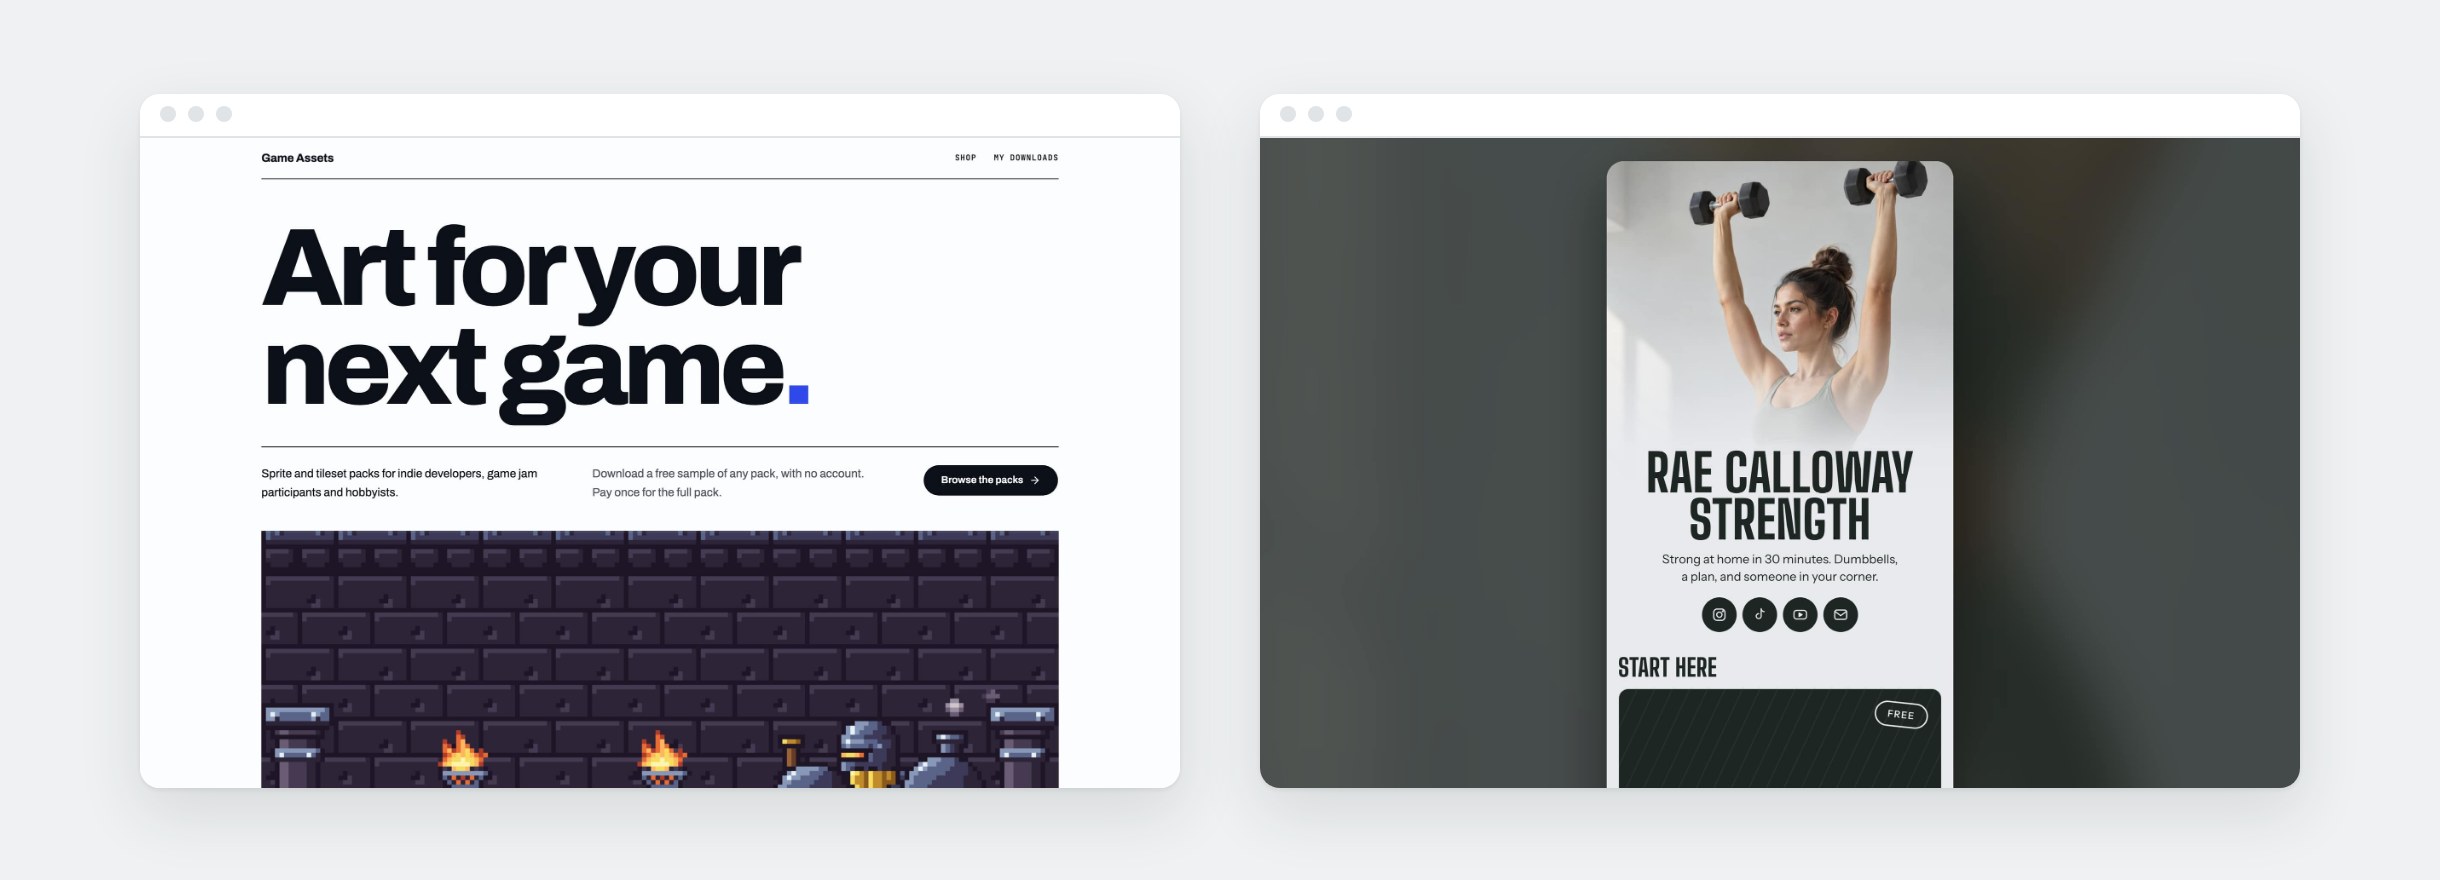
Digital downloads (9%). Templates lead, especially social media templates that small businesses fill in with their own photos and text, and invitations for weddings and parties. One shop sells a pack of ten templates real estate agents use to announce new listings. Printables, ebooks, planners and coloring books follow. Nearly all are one-time purchases, usually around $19. The Game Assets and Shop the Bio templates are good examples of these types of businesses.
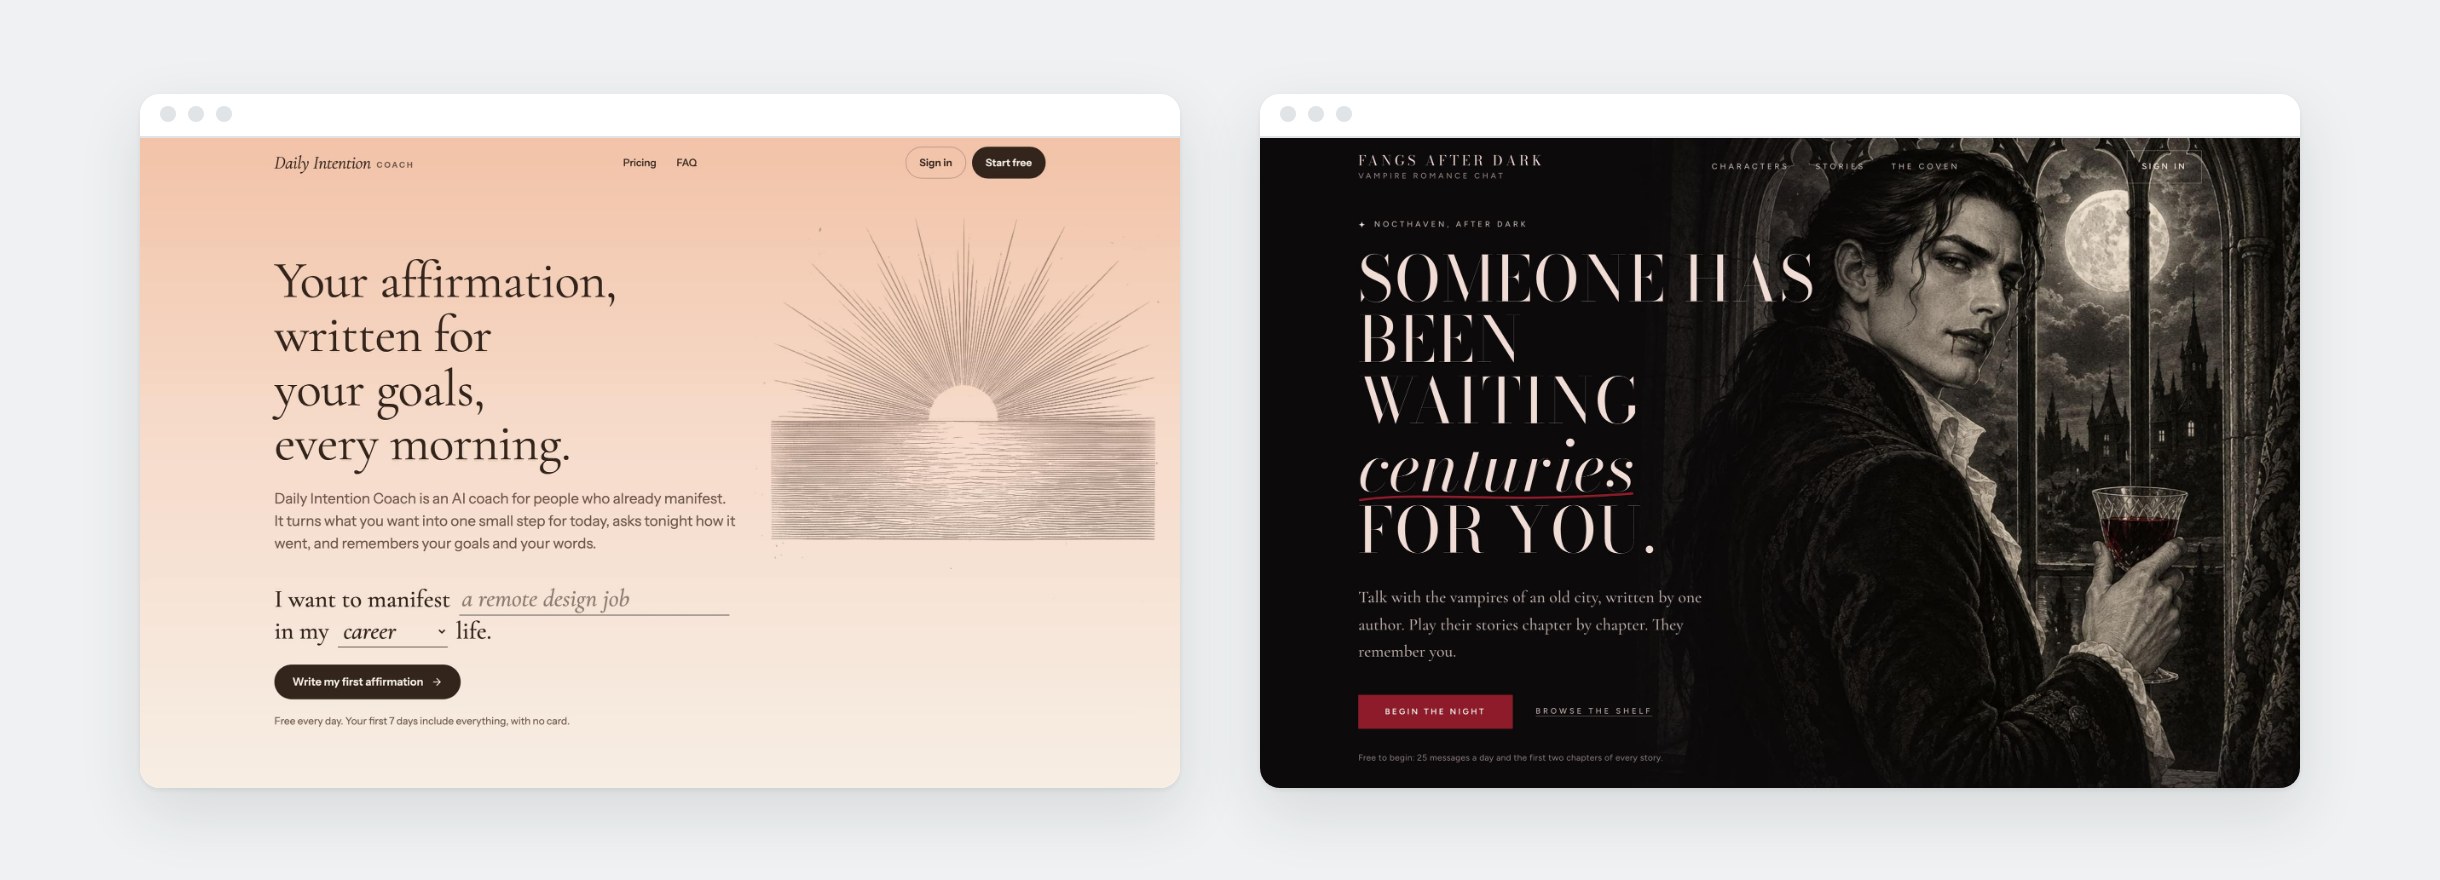
AI advisors (8%). A chat assistant for one subject, often built on the owner’s own knowledge. We saw advisors for home repair, car trouble, fitness after 50, focus for people with ADHD, astrology, and dinner ideas from what’s in your fridge. Most charge about $10 a month. One answers health and law questions in plain language, with two free questions and then a subscription under $10 a month. See the Daily Intention Coach and Fangs After Dark templates for two ways to set one up.
Communities and social apps (7%). Dating sites, apps for couples, short-video sharing, creator platforms, faith groups and member clubs. Some charge a subscription, and many start free. Rain Check is an example of a paid newsletter built around Seattle’s food scene.
Software for small businesses (7%). Mostly tools for contractors and home-service businesses that capture leads, text back missed calls, or answer the phone and book jobs with AI. Tools for realtors come next. One we saw tracks inspections, licenses, renewals and repairs for small landlords and contractors, emails a reminder before each is due, and keeps proof that the work was done. This category charges the most, usually around $29 a month.
AI creative tools (6%). Apps that make songs, edit videos, turn photos into portraits, or show a room after a renovation. Music was the most popular by far. Our Podcast Studio template includes an AI producer that helps write and voice each episode.
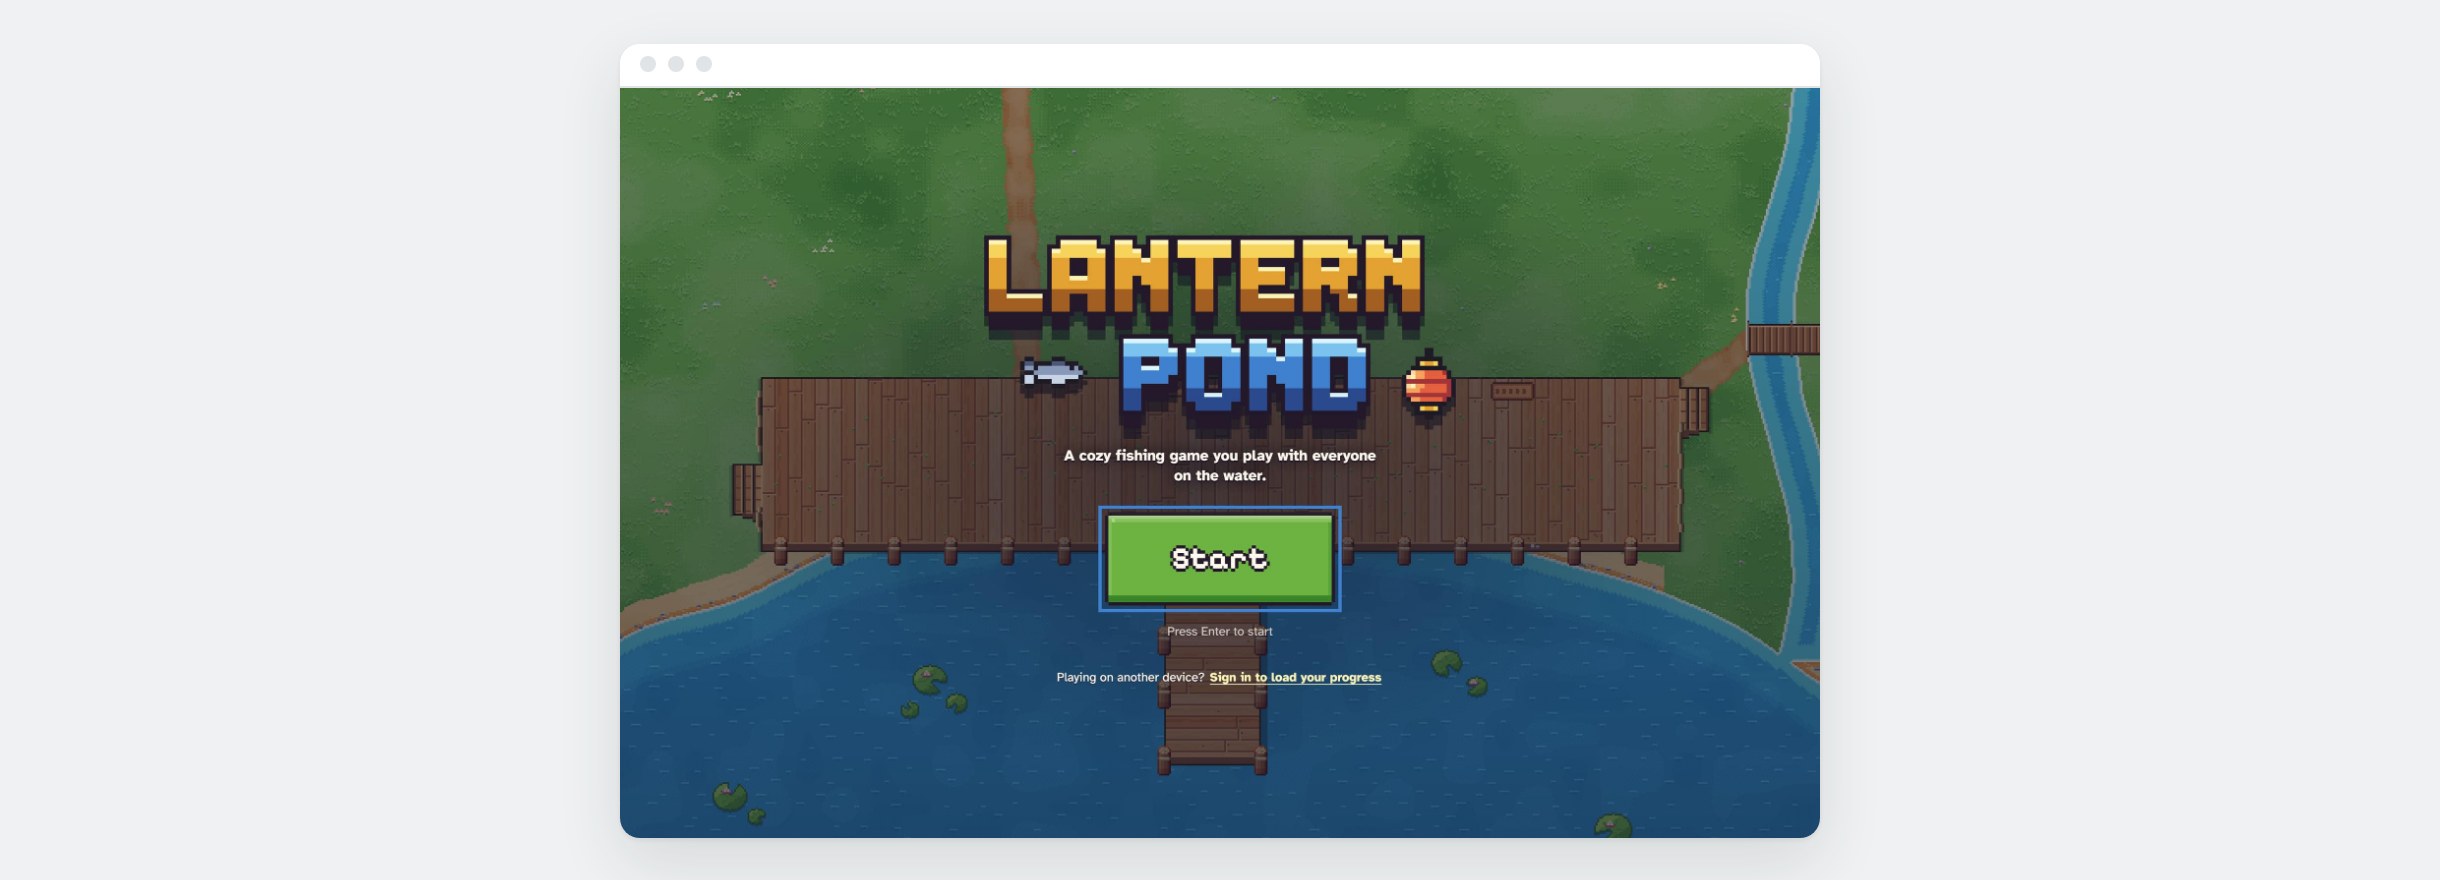
Games (5%). Browser and mobile games, games for kids, simulators and play-money casino games. About half are free, like our multiplayer fishing game, Lantern Pond.
Marketplaces (5%). Local odd-jobs boards, job boards for a single trade, auctions for collectibles, and local delivery and rides. Many take a cut of each sale. Directories are a simpler version, like our Seattle Wedding Vendor Guide, where vendors pay a monthly fee to be listed.
Courses (5%), information sites (4%) and health and fitness programs (4%) round out the list. You can find a template for most of these categories in our business templates.
A quarter are selling AI
About one in four projects sells AI in some way. The most common kind is an assistant that answers questions on one subject, like the health and law assistant described above. Apps that make songs, images and videos come next. A third kind uses AI to automate work that service businesses already sell, like audits and reviews.
AI also shows up in about a third of courses and health apps, and in close to half of the software sold to small businesses. Stores and service businesses rarely use it. For the other three in four projects, AI is how the business got built, and the customer never sees it.
How they plan to make money
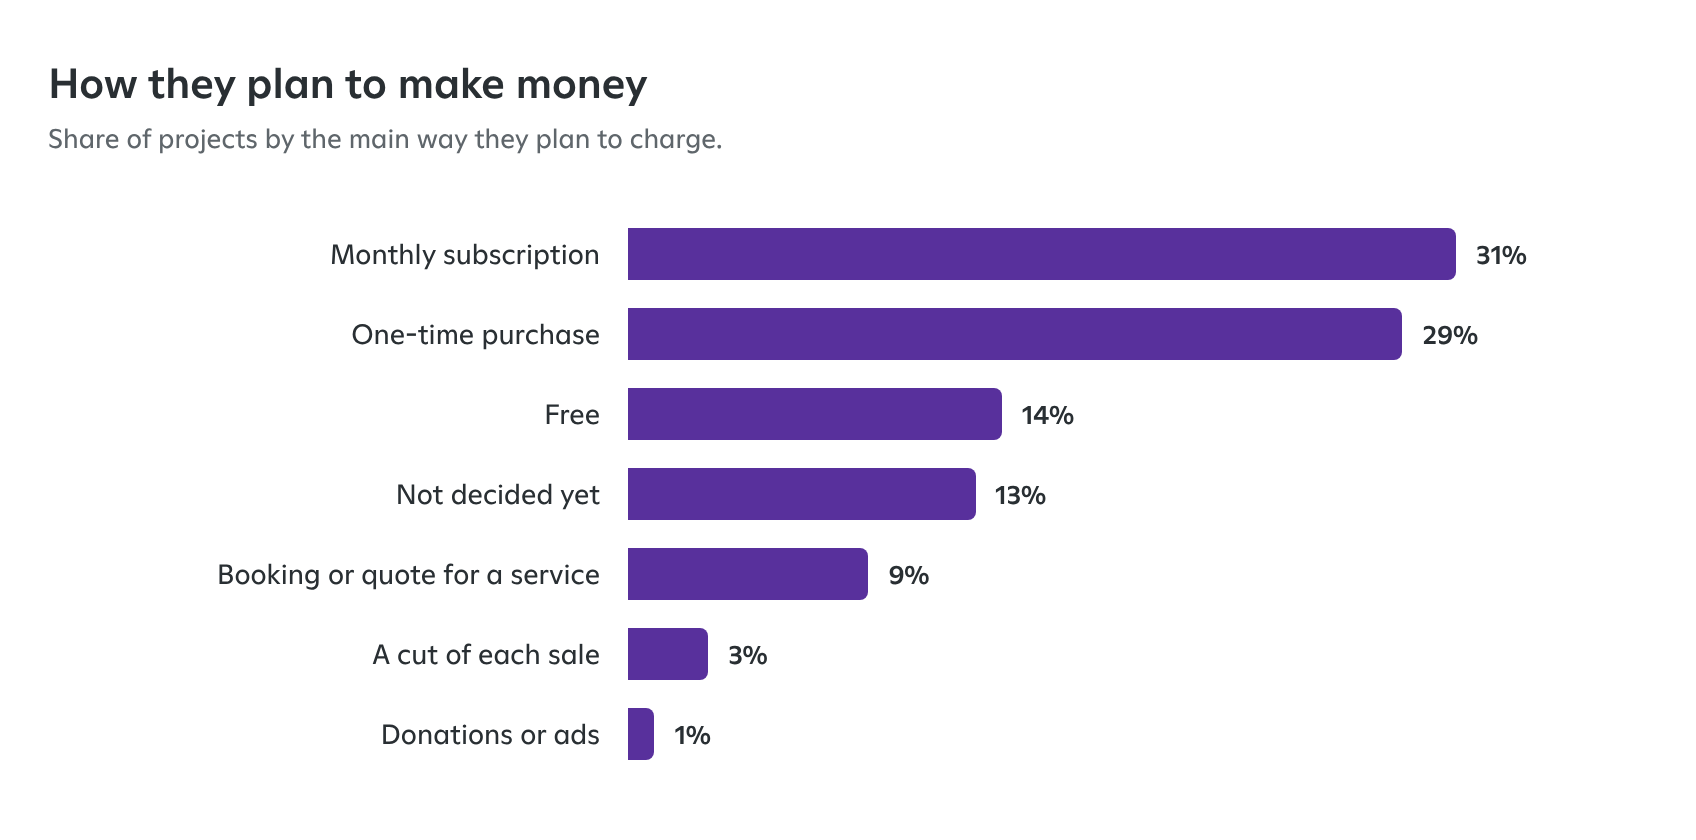
Subscriptions (31%) and one-time sales (29%) are about even. Stores and downloads sell once, while apps, advisors and business software charge monthly.
About one in seven projects plan to be free, and another 13% haven’t picked a pricing model yet.
What a subscription costs
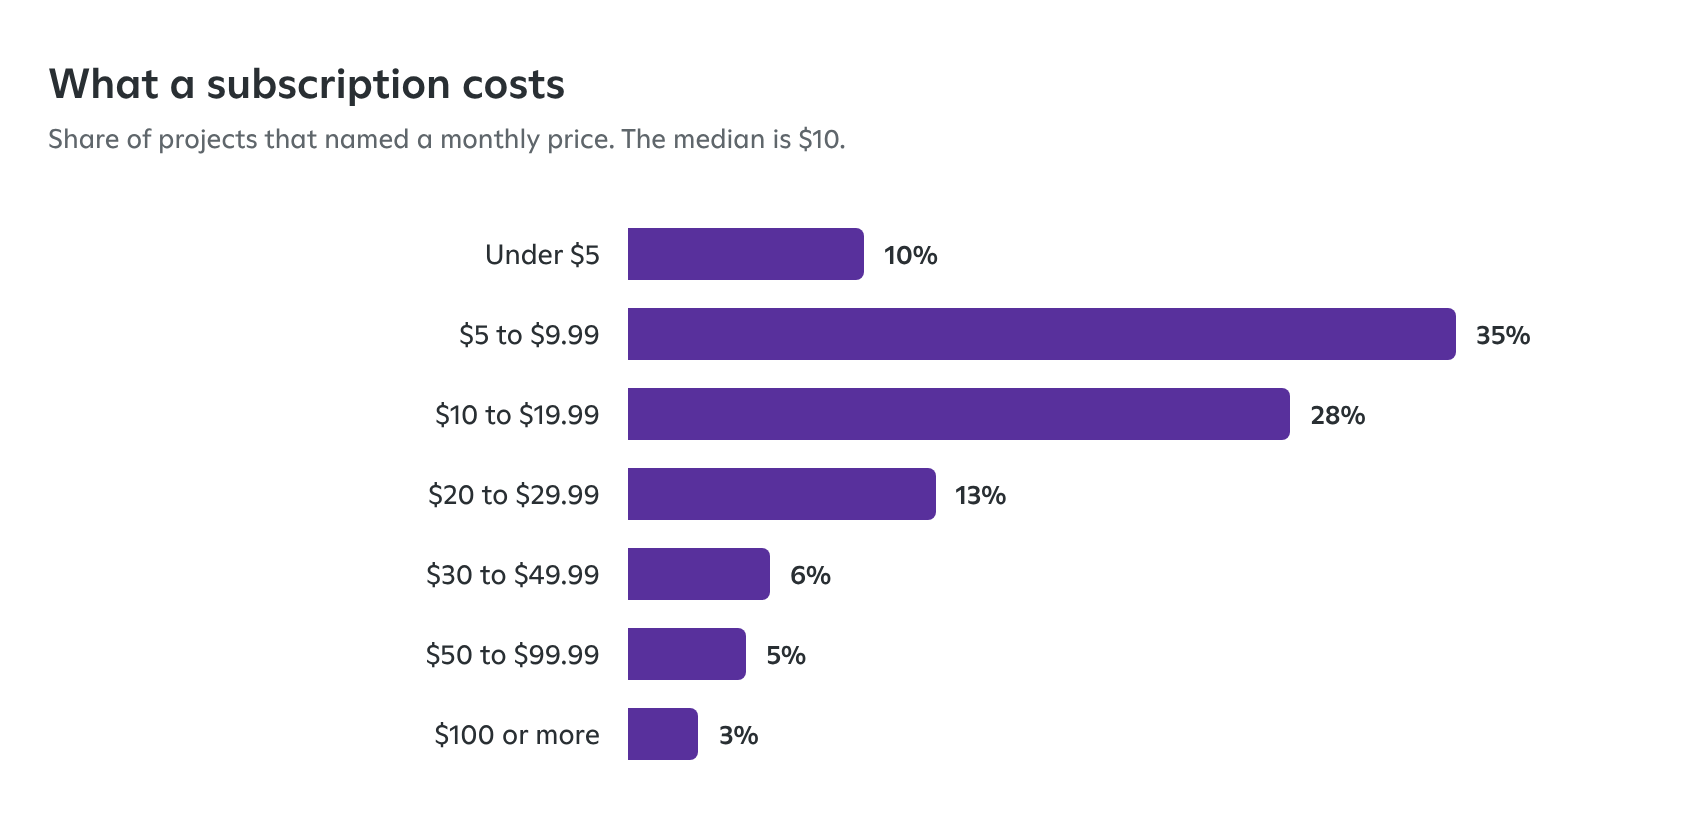
The median monthly price for consumer subscriptions was $10, and roughly half of those projects cost $7 to $20. Software for businesses was priced higher, at a median of $29 a month.
If you’re thinking about starting something
- Pick the right idea for you. Stores, service businesses and digital downloads are common first picks because they’re easy to explain and easy to charge for.
- Think about distribution from the beginning. Marketing the product matters as much as building it. Ask Spark to interview you about your business and suggest ways to find your first customer.
- Get ready for the journey. Starting a business is hard. Expect ups and downs, and give yourself time to work through them.
If you have an idea, start building on Spark, or start from one of the business templates and change it to fit. Our guide to starting a business with AI covers the steps, and pricing shows what a paid plan includes.
About the data. We analyzed a sample of about 1,500 projects started on Spark between late September and late October 2026, excluding our own team’s accounts. Each project was assigned one category, so treat the percentages as approximate. Prices are what each plan said when the project started. We report the data only in aggregate: examples are paraphrased, and nothing here identifies a project or the person behind it.