

State of Starting Up
The State of Starting Up: A record year for new businesses
Americans filed more new business applications in 2026 than in any year on record. Here's what they're starting, where, and what they earn.

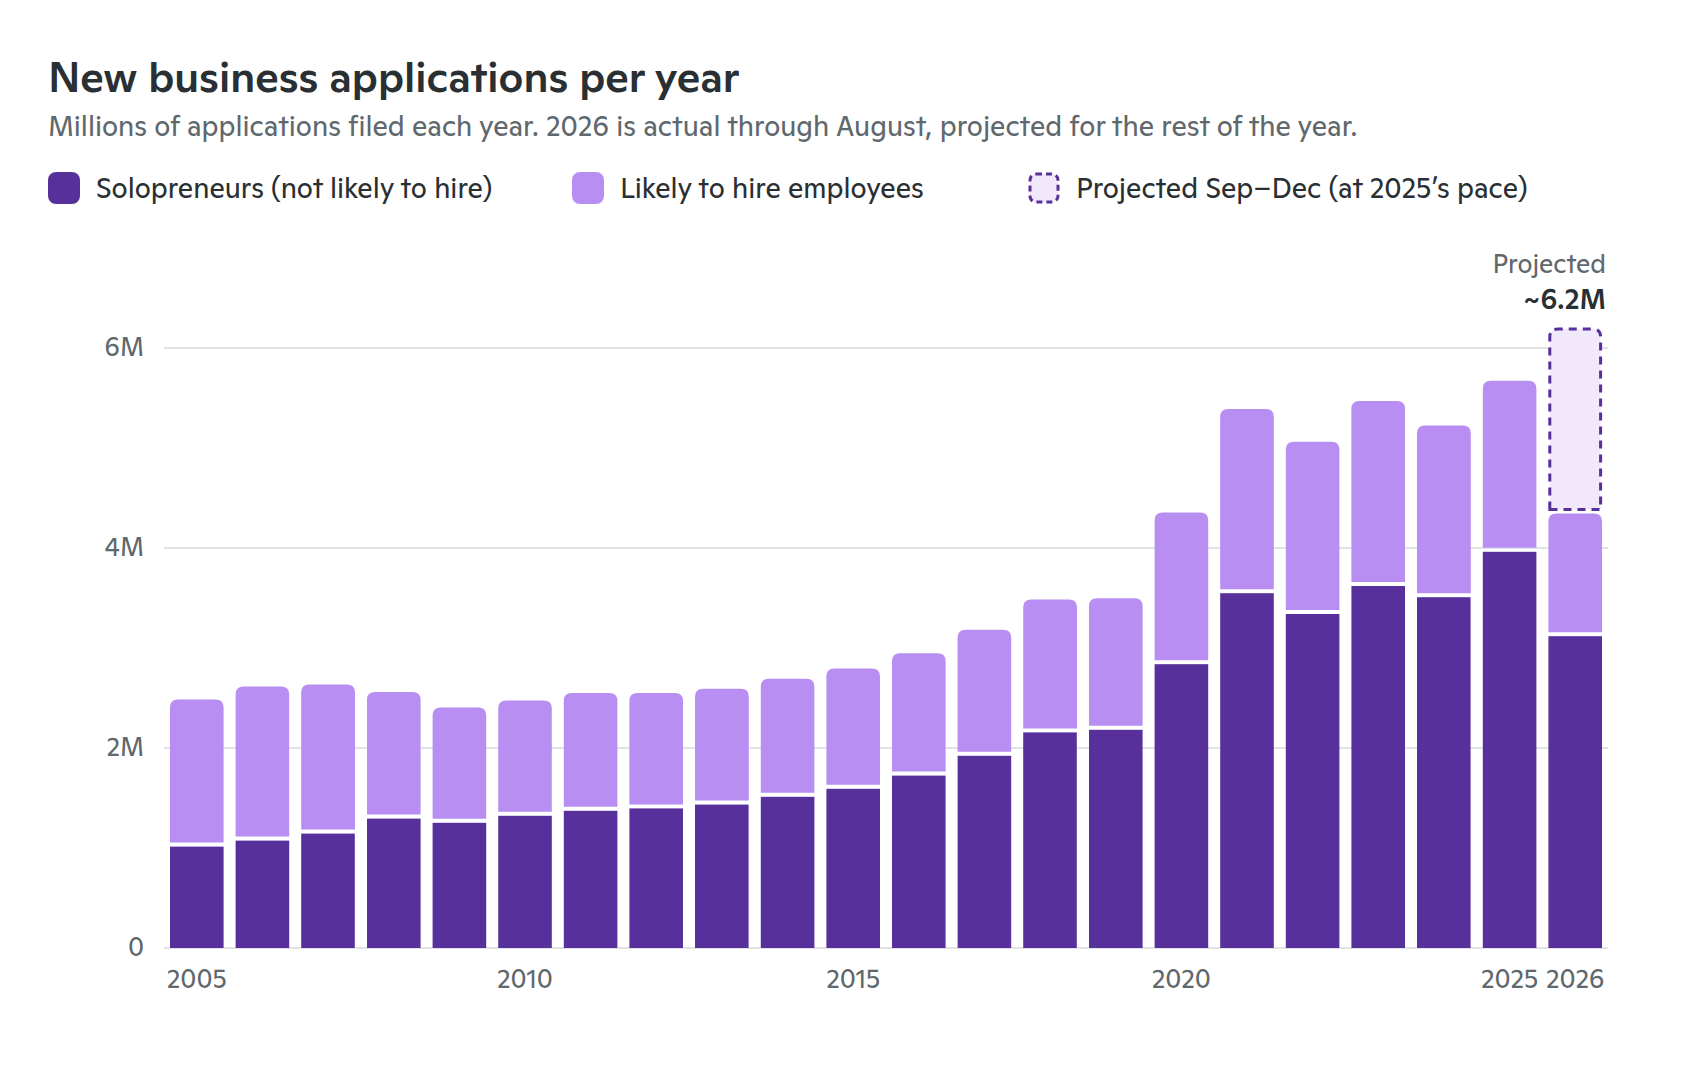
Each month, The State of Starting Up looks at one question about how people are starting businesses and making money on their own. Our first issue starts with how many people are starting something right now.
More new businesses than ever before
Between January and August 2026, Americans filed 4,345,310 applications to start a new business, according to the Census Bureau.
That’s the most for the first eight months of any year in the Census data, which starts in 2004. It’s 13.5% more than the same months of 2025, and 75% more than in 2019.
Last year set the record, with 5.67 million applications. If the last four months of 2026 are as busy as the same months of 2025, this year will finish at about 6.2 million, almost 10% above the record.
Most founders are solopreneurs
The data also shows how many of these new businesses are started by solopreneurs: people starting something on their own, with no plans to hire. That’s the real story of this boom.
So far this year, 3.1 million applications (72% of the total), came from solopreneurs. That’s double the number in the same months of 2019, up 102%. Other applications from businesses likely to hire grew too, but only by 31%.
These are people starting a consultancy, an online shop, or a service run from a laptop or a truck. Many will stay one-person businesses, and many will bring in extra income alongside a job.
An application isn’t a business yet, and some never make a sale. But still, there are twice as many solopreneurs taking this first formal step compared to 2019.
What people are starting
Retail (which includes online retail) is the biggest category by far. It’s also where the most growth is.
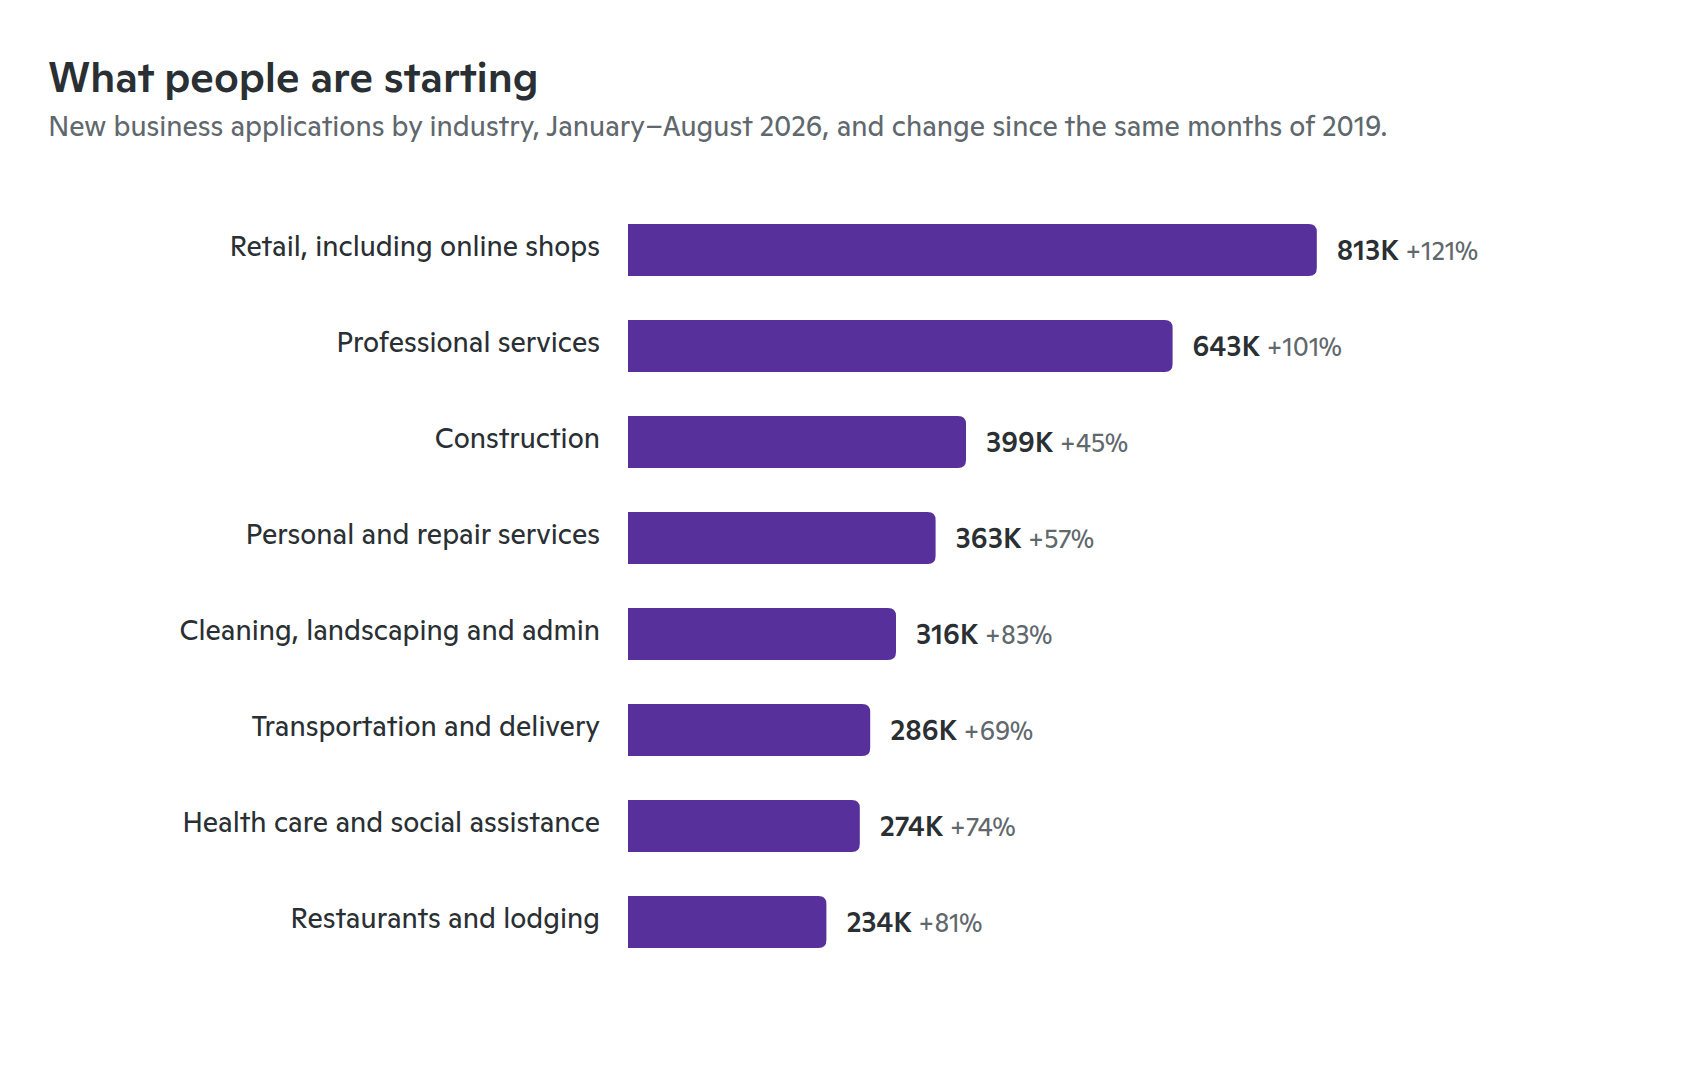
A few things stand out:
- Retail has more than doubled. Retail is up 121% since 2019, and it accounts for nearly a quarter of all the growth. Four in five retail businesses are started by solopreneurs.
- Know-how is the second-biggest category. Professional services, including consulting, design, marketing, and bookkeeping, are up 101%.
- Local services are growing fast too. Cleaning, landscaping, and other support services are up 83%. Personal services and repair, which covers everything from hair and nails to pet care and fixing things, are up 57%.
- Some categories look very different. Nearly every new restaurant application and about two-thirds of health care applications are counted as likely to hire. It’s harder to be a solopreneur if you want to start a restaurant.
Where people are filing
You might expect new businesses to cluster in the coastal tech hubs, around San Francisco, Seattle, and New York, but the data paints a different picture.
Per person, the busiest states are in the South and the Mountain West. California, New York, and Washington are actually all below the national average.
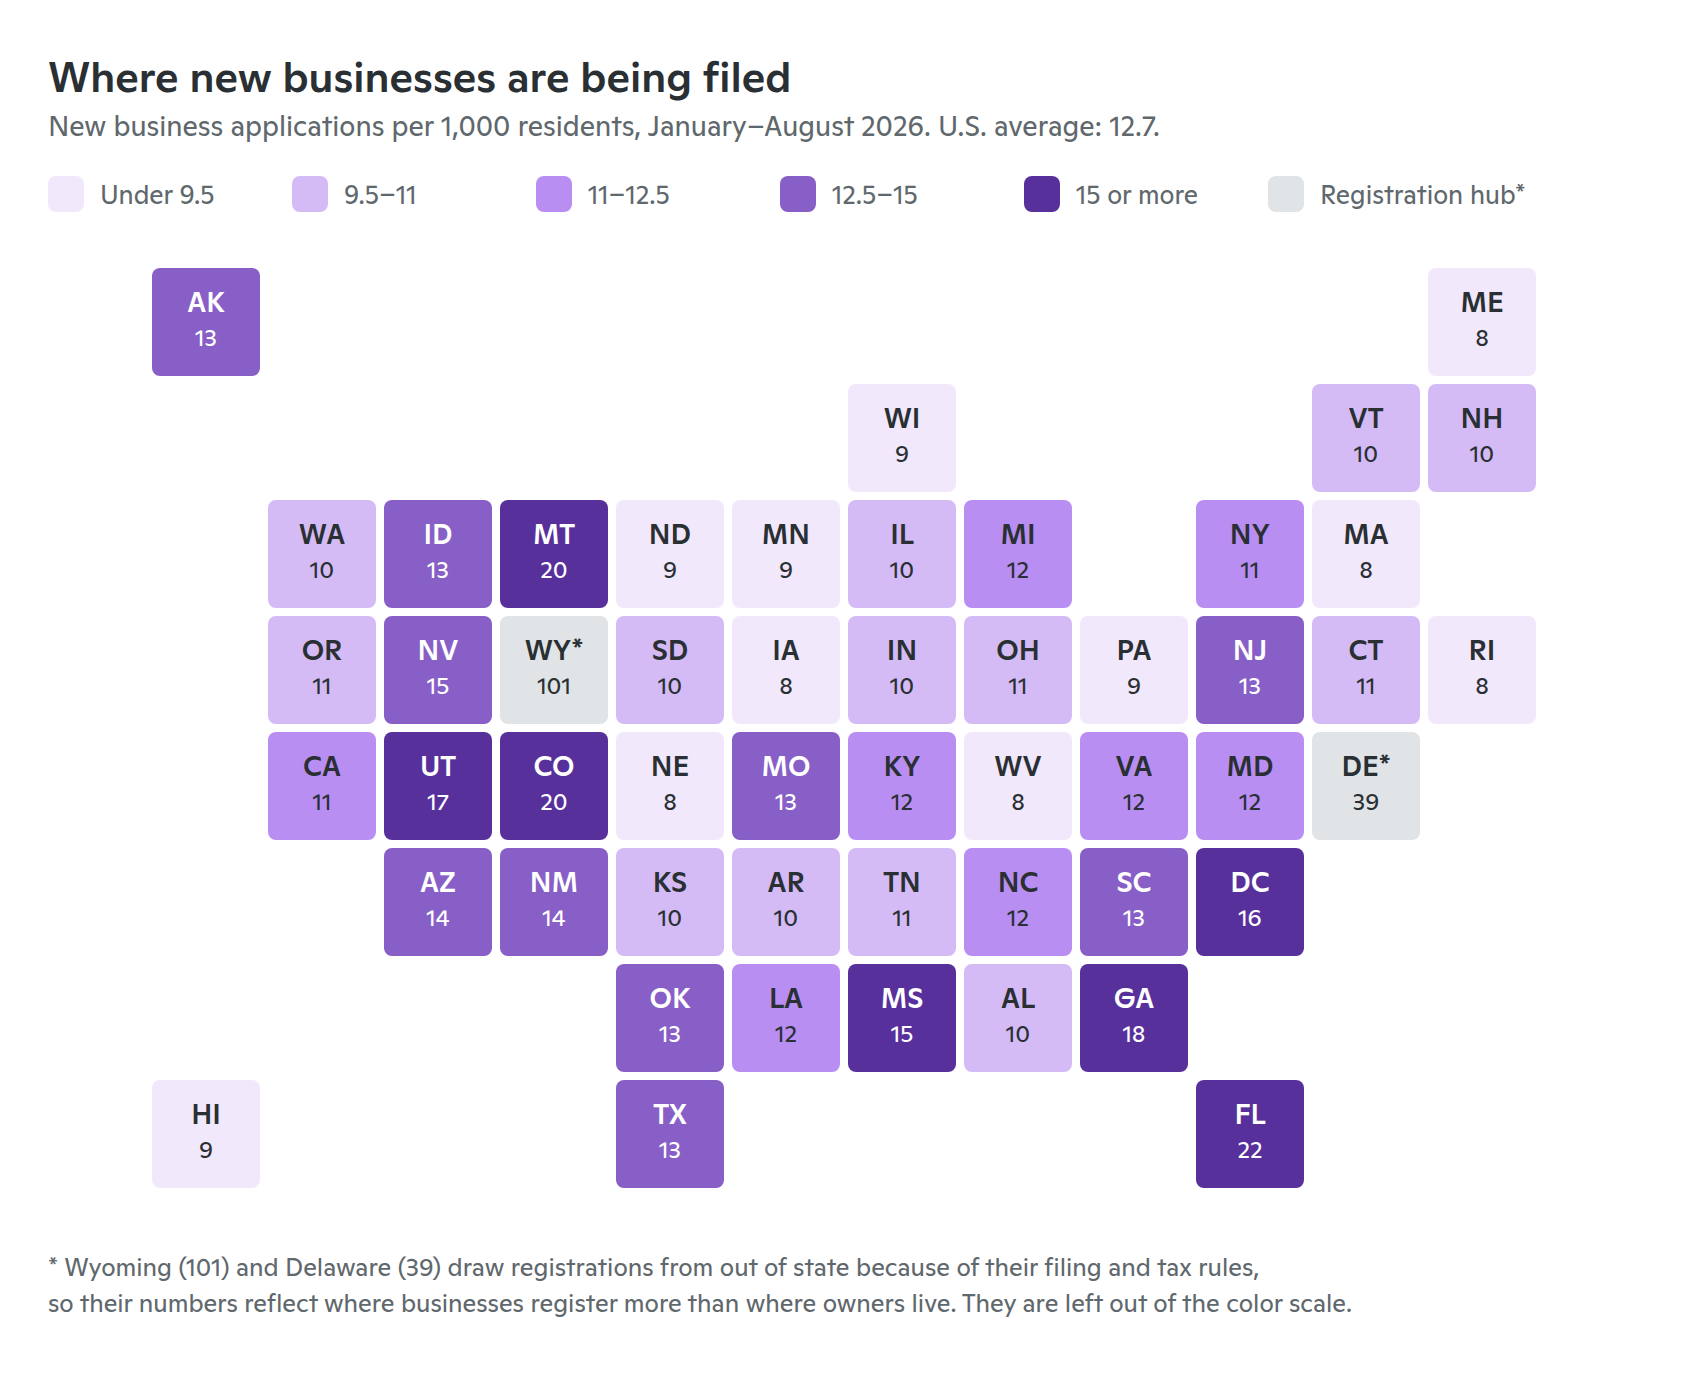
Florida leads the country on both total filings and filings per person. Its residents filed 514,279 applications this year, more than any other state, and 22 for every 1,000 people.
California (439,856) and Texas (403,187) follow on total filings. Colorado, Montana, Georgia, and Utah follow Florida at the top of the per-person list, while the lowest rates are in West Virginia, Maine, Nebraska, and Rhode Island.
Some of the fastest growth is in places you might not expect. Compared with 2019, applications have more than doubled in New Mexico (up 143%), Kentucky (134%), and Montana (124%).
What one-person businesses actually earn
According to a Census Bureau report, about one in four businesses with no employees brings in $50,000 or more a year. That’s 7.9 million businesses.
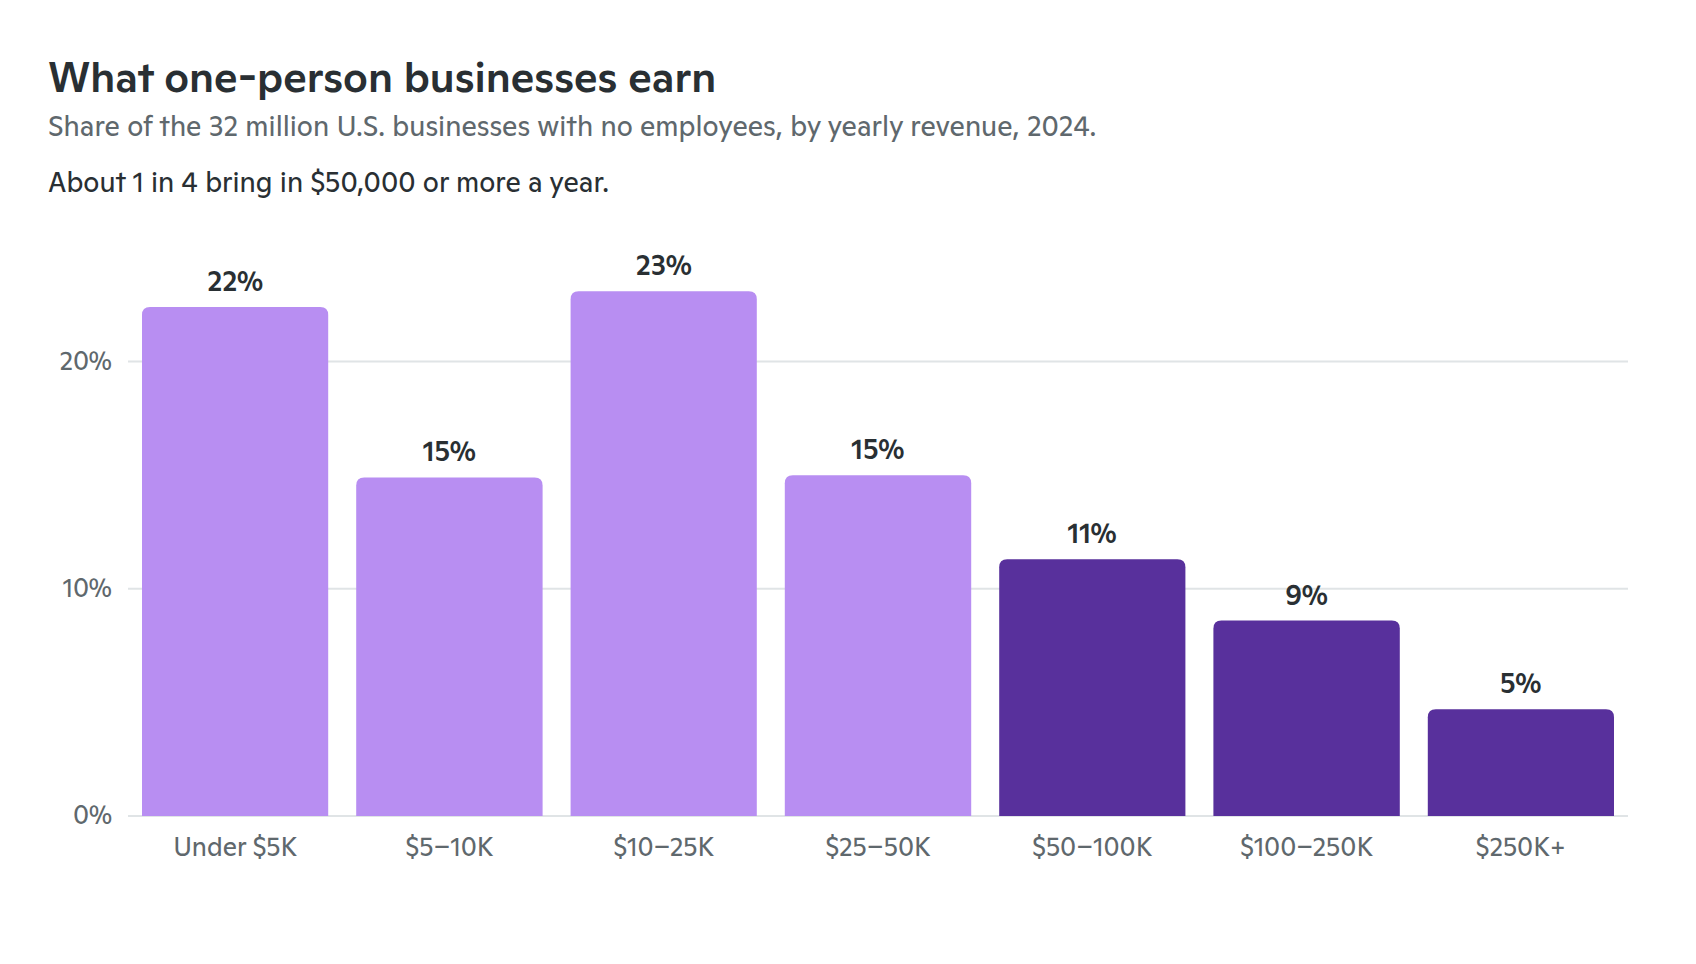
At the top, about one in eight clears $100,000. At the other end, six in ten bring in less than $25,000, which fits a picture of a lot of people earning extra income on the side.
What these solo businesses bring in depends a lot on the kind of work. Here is the average yearly revenue (before expenses) for businesses with no employees in 2024:
| Kind of business | Businesses | Average revenue |
|---|---|---|
| Couriers and delivery | 1.6 million | $14,900 |
| Tutoring and other education | 0.9 million | $18,700 |
| Cleaning, landscaping, and admin support | 3.1 million | $29,400 |
| Taxi and rideshare | 1.6 million | $29,900 |
| Personal services and repair | 3.4 million | $38,700 |
| Professional services | 4.2 million | $58,900 |
| Retail | 2.2 million | $64,300 |
| Construction | 3.0 million | $84,900 |
| Real estate | 3.3 million | $111,300 |
The biggest shift is in delivery. The number of couriers and delivery businesses with no employees has more than tripled since 2019, up 221% to 1.6 million. It’s now one of the most common ways to work for yourself, but one of the lowest-paying.
What side income looks like
The Federal Reserve’s survey of household finances asks people how they earn money outside a regular job. In its 2024 survey, 20% of adults had earned money from a side activity in the past month.
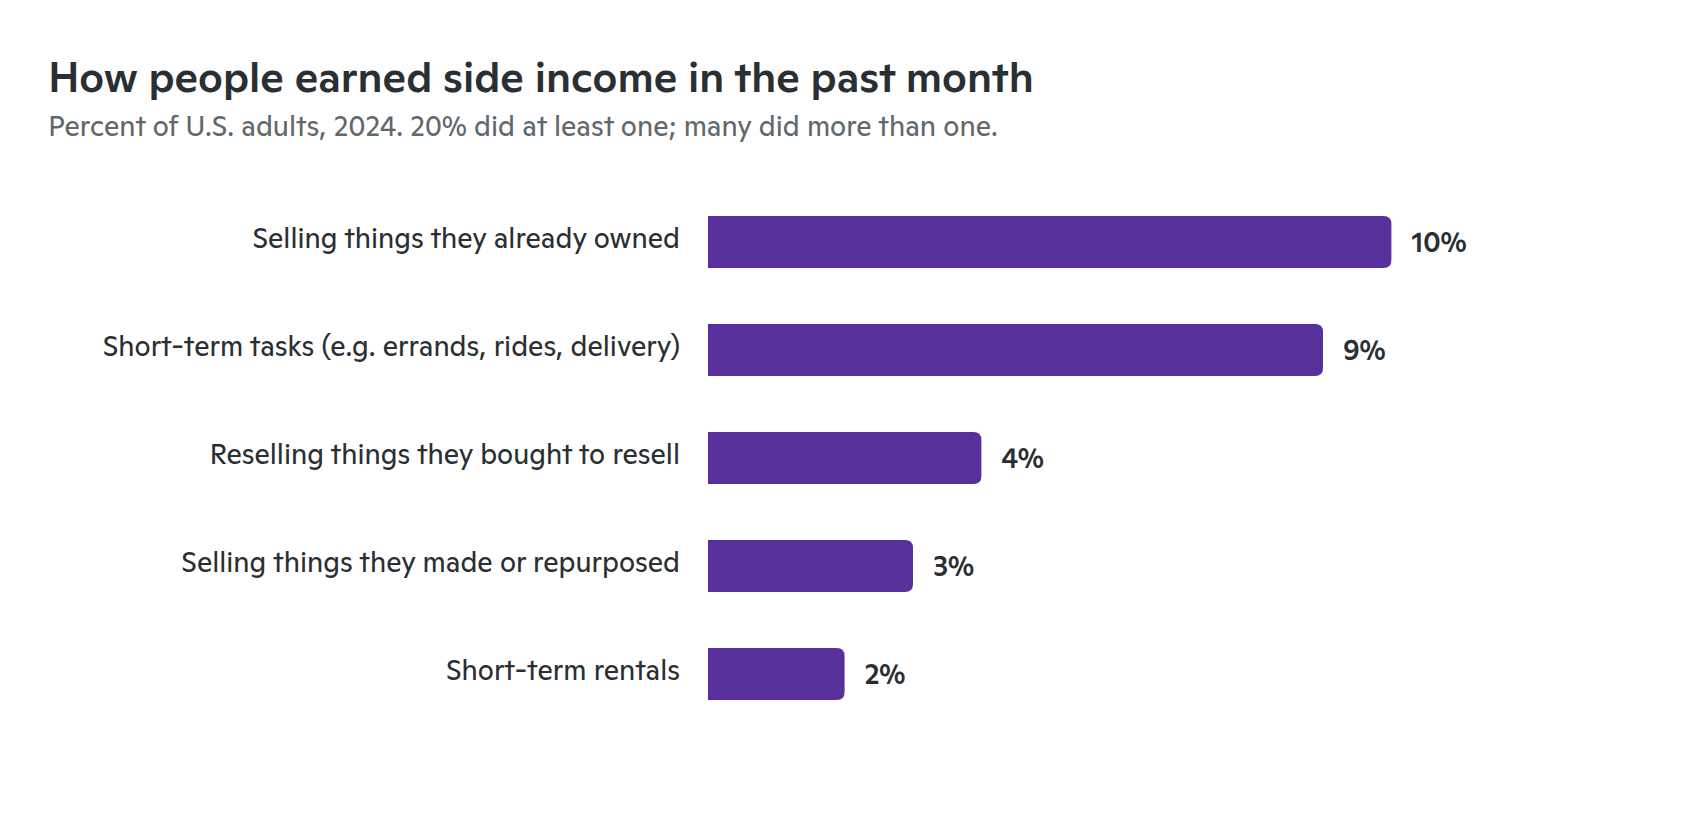
- Less than five hours a week. 70% of people earning side income spent less than five hours a week on it. Only 21% called it their main job, and 51% also had a regular job.
- People want side income for control. The statement people agreed with most was that it let them be their own boss.
- The pay is uneven. Nearly half wished it were more consistent. In the Fed’s 2025 survey, 58% of self-employed adults said their income varied from month to month.
Overall, second jobs haven’t changed much. In August 2026, 5.4% of employed people held more than one job, up slightly from 5.1% in 2019 and below the 6.5% peak of the mid-1990s.
The growth really shows up in people selling something on their own terms.
What it means if you’re thinking about starting
- You’re in good company. More people are taking this step than at any point in the last 20 years, and most of them are starting small.
- Small is normal. Most new applicants don’t plan to hire anyone, and most one-person businesses bring in less than $25,000 a year. Starting with a few hours a week is common.
- What you sell matters. A one-person professional services or construction business brings in several times what a delivery business does, on average. If you have a skill people pay for, price it like one.
So is now a good time to start a business? Yes!
Our advice? Start small. Getting started is usually the hardest part.
If you’re ready to build your first business idea, try Spark today.
Next month
We’ll look at what people are actually selling, and what they charge for it.
About the data. New business figures are from the U.S. Census Bureau’s Business Formation Statistics, released September 11, 2026, for data through August. Yearly totals add up the unadjusted monthly figures. Comparisons between 2026 and earlier years use January through August of each year, so every year is compared over the same months. The 2026 projection adds 2025’s actual September–December applications (1.84 million) to 2026’s actual January–August total (4.35 million). “Solopreneurs” are the applications outside Census’s high-propensity series, the ones Census does not consider likely to hire employees. Per-person rates use Census’s 2025 state population estimates. Figures on businesses with no employees are from Census’s 2024 Nonemployer Statistics, released September 29, 2026, which count businesses with at least $1,000 in revenue. Side-income figures are from the Federal Reserve’s Economic Well-Being of U.S. Households in 2024 report, and the income-variability figure is from the 2025 report. The multiple-jobholding rate is from the Bureau of Labor Statistics, via FRED.